■ Numpy
[문제 1]
- 0이상 10미만의 3x3 모양의 정수 난수를 생성하고 각 행의 첫 번째 값을 기준으로 정렬
import numpy as np
import pandas as pd
a = np.random.randint(0, 10, (3,3))
print(a)
# 모든 행의 0번째 값으로 argsort (정렬된 인덱스 값을 반환)
aa = a[np.argsort(a[:, 0])]
print(aa)[[0 1 5]
[9 8 4]
[0 8 2]]
[[0 1 5]
[0 8 2]
[9 8 4]][문제 2]
- 8x8 모양의 정수 0으로 채워진 행렬을 만들고 인덱싱과 슬라이싱을 이용하여 체크보드 패턴을 만드세요.
b = np.zeros((8,8), dtype=int)
print(b)
[[0 0 0 0 0 0 0 0]
[0 0 0 0 0 0 0 0]
[0 0 0 0 0 0 0 0]
[0 0 0 0 0 0 0 0]
[0 0 0 0 0 0 0 0]
[0 0 0 0 0 0 0 0]
[0 0 0 0 0 0 0 0]
[0 0 0 0 0 0 0 0]]
# 1번째 행에서 2번씩 건너띄면서 1의 값으로 채움
b[1::2, ::2] = 1
# 0번째 행에서 2번씩 건너띄면서 1의 값으로 채움
b[::2, 1::2] = 1

print(b)
[[0 1 0 1 0 1 0 1]
[1 0 1 0 1 0 1 0]
[0 1 0 1 0 1 0 1]
[1 0 1 0 1 0 1 0]
[0 1 0 1 0 1 0 1]
[1 0 1 0 1 0 1 0]
[0 1 0 1 0 1 0 1]
[1 0 1 0 1 0 1 0]] [문제 3]
- 0이상 1미만 사이의 값을 갖는 크기 10의 랜덤 벡더를 만들고 최대값을 0으로 바꾸는 코드를 만드세요.
c = np.random.rand(10)
print(c)
[0.01018574 0.01086992 0.88268944 0.38003198 0.80431497 0.98596213
0.30289928 0.90198483 0.89820724 0.75826985]c[c.max() == c] = 0
print(c)
# 동일한 결과
c[c.argmax()] = 0
print(c)[0.01018574 0.01086992 0.88268944 0.38003198 0.80431497 0.
0.30289928 0.90198483 0.89820724 0.75826985]
■ Pandas
[문제 1] 월드컵 출전선수 골 기록 데이터 분석
df = pd.read_csv('worldcupgoals.csv')
(1) 주어진 전체 기간의 각 나라별 골 득점수 합계 상위 5개 국가와 그 득점수를 출력
df.groupby('Country')[['Goals']].sum().sort_values(by='Goals',ascending=False).head()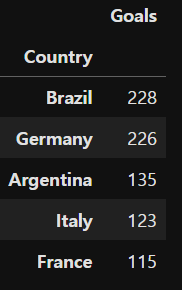
(2) 주어진 전체기간동안 골득점을 한 선수가 가장 많은 나라 상위 5개 국가와 그 선수 숫자를 출력
df.groupby('Country').count().sort_values(by='Player', ascending=False)[['Player']].head()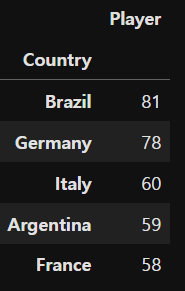
(3) Years 컬럼은 년도-년도 형식으로 구성되어있고, 각 년도는 4자리 숫자이다. 각 년도 표기가 4자리 숫자로 안된 케이스가 존재한다. 해당 건은 몇 건인지 출력 (for문 이용)
# 방법(1)
not_four_years = []
for year in df['Years']:
    years = year.split('-')
    not_four = [y for y in years if len(y) != 4]
    if not_four:
        not_four_years.append(not_four)
print(len(not_four_years)) # 45개
# 방법(2)
count = 0
for years in df['Years']:
for year in years.split('-'):
if len(year) != 4:
count += 1
print(count) # 45개
(4) 3번 문제에서 발생한 예외 케이스(년도 표기가 4자리가 아닌 경우)를 제외한 새로운 데이터프레임을 생성하고 전체 데이터 행의 숫자를 출력 (년도 표기가 4자리 숫자가 아닌 경우를 검사하는 함수를 만든 후 apply 함수를 이용하여 Year 컬럼에 적용)
# 방법(1)
def Not_four(years):
    not_four = [y for y in years if len(y) != 4]
    return bool(not_four)

df = df[df['Years'].apply(lambda x: not Not_four(x.split('-')))]
len(df.index) # 1250
# 방법(2)
def CheckYearFormat(years):
    for year in years.split('-'):
        if len(year) != 4:
            return False
    else:
        return True

df['year_check'] = df['Years'].apply(lambda x: CheckYearFormat(x))

# year_check의 값이 True인 것만 반환
df2 = df[df['year_check']]
df2.head()
df2.shape # (1250, 5)
(5) 월드컵 출전횟수를 나타내는 'LenCup' 컬럼을 추가하고 4회 출전한 선수의 숫자
# 경고 메세지 무시
import warnings
warnings.filterwarnings(action='ignore')
df2['LenCup'] = [len(years.split('-')) for years in df2['Years']]len(df2[df2['LenCup'] == 4]) # 16명
(6) yugoslavia 국가의 월드컵 출전횟수가 2회인 선수들의 숫자
# 방법(1)
df.loc[np.logical_and(df['Country'] == 'Yugoslavia',df['LenCup'] ==2), ['Player']]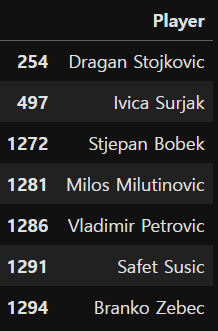
# 방법(2)
len(df2[df2['Country'] == 'Yugoslavia'][df2['LenCup'] == 2]) # 7명
(7) 2002년도에 출전한 전체 선수 수
# 방법(1)
df.loc[df['Years'].str.contains('2002'), ['Player']].count()
Player 156
dtype: int64# 방법(2)
len(df2[df2['Years'].str.contains('2002')]) # 156명
(8) 월드컵 출전횟수가 1회 뿐인 선수들 중에서 가장 많은 득점을 올렸던 선수는 누구이며 몇 골을 넣었는지
# 방법(1)
df.loc[df['LenCup'] == 1, ['Player','Goals']].sort_values(by='Goals',ascending=False).head(1)
# 방법(2)
df2[df2['LenCup'] == 1].sort_values(by='Goals', ascending=False).head(1)[['Player','Goals']]
[문제 2] 전 세계 행복도 지수 데이터 분석
hp = pd.read_csv('happiness.csv')
(1) 각 연도별 행복랭킹 10위 안에 드는 나라의 행복점수의 평균
# 방법(1)
top10_avg_2019 = hp[np.logical_and(hp['행복랭킹'] < 11, hp['년도'] == 2019)][['점수']].mean()
top10_avg_2018 = hp[np.logical_and(hp['행복랭킹'] < 11, hp['년도'] == 2018)][['점수']].mean()

print('2019년 평균:', top10_avg_2019)
print('2018년 평균:', top10_avg_2018)
2019년 평균: 점수 7.4559
dtype: float64
2018년 평균: 점수 7.4442
dtype: float64
# 방법(2)
grouped = hp.groupby('년도')
for year, group in grouped:
    print(f'{year}년도', end=': ')
    print(group[group['행복랭킹'] <= 10]['점수'].mean().round(2))
2018년도: 7.44
2019년도: 7.46
# 방법(3)
hp[hp['행복랭킹'] <= 10].groupby('년도')['점수'].mean().round(2)
년도
2018 7.44
2019 7.46
Name: 점수, dtype: float64
(2) 각 연도의 행복랭킹 50위 이내의 나라들의 각각의 행복점수 평균을 데이터프레임으로 표시
# 방법(1)
top50_2019 = hp[np.logical_and(hp['행복랭킹'] < 51, hp['년도'] == 2019)][['점수']]
top50_2018 = hp[np.logical_and(hp['행복랭킹'] < 51, hp['년도'] == 2018)][['점수']]

print('2019년 평균:', np.mean(top50_2019))
print('2018년 평균:', np.mean(top50_2018))
2019년 평균: 6.670020000000001
2018년 평균: 6.64678
# 방법(2)
hp[hp['행복랭킹'] <= 50].groupby('년도')[['점수']].mean().round(2)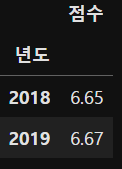
(3) 각 년도별 행복점수의 하위 5개 국가의 평균 행복점수
hp.sort_values(['년도','점수']).groupby('년도').head(5).groupby('년도')['점수'].mean().round(2)년도
2018 3.18
2019 3.14
Name: 점수, dtype: float64
# 풀어서 쓰는 방법
grouped = hp.groupby('년도')
for year, group in grouped:
    print(f'{year}년도', end=': ')
    print(group.sort_values('점수').head(5)['점수'].mean().round(2))
2018년도: 3.18
2019년도: 3.14
(4) 2019년 데이터를 추출하고 해당 데이터의 상대 GDP 평균 이상의 나라들과 평균 이하의 나라들의 행복점수 평균을 각각 구하고 그 차이 값을 출력
# 방법(1)
GDP_avg = hp['상대GDP'].mean()
GDP_avg_upper = hp.loc[np.logical_and(hp['년도'] == 2019, hp['상대GDP'] >= GDP_avg), ['나라명','점수','상대GDP']].sort_values(by='상대GDP', ascending=False)
GDP_avg_lower = hp.loc[np.logical_and(hp['년도'] == 2019, hp['상대GDP'] < GDP_avg), ['나라명','점수','상대GDP']].sort_values(by='상대GDP', ascending=False)
print(np.mean(GDP_avg_upper['점수']) - np.mean(GDP_avg_lower['점수']))
1.3904839572192502
hp_2019 = hp[hp['년도'] == 2019]
over_mean = hp_2019[hp_2019['상대GDP'] >= hp_2019['상대GDP'].mean()]['점수'].mean()
under_mean = hp_2019[hp_2019['상대GDP'] < hp_2019['상대GDP'].mean()]['점수'].mean()
print(np.round(over_mean - under_mean, 2))
1.39
(5) 각 년도의 부패에 대한 인식을 내림차순 정렬했을 때 상위 20개 국가의 부패에 대한 인식의 평균
hp.sort_values(['년도','부패에 대한인식'], ascending=False).groupby('년도').head(20).groupby('년도')[['부패에 대한인식']].mean()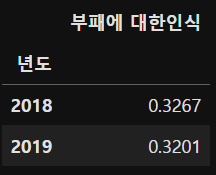
(6) 2018년도 행복랭킹 50위 이내에 포함됐다가 2019년 50위 밖으로 밀려난 국가
d1 = hp[np.logical_and(hp['년도'] == 2018, hp['행복랭킹'] <= 50)]['나라명']
d1
d2 = hp[np.logical_and(hp['년도'] == 2019, hp['행복랭킹'] > 50)]['나라명']
d2
d2[d2.isin(d1)]
50 Kuwait
51 Thailand
79 Malaysia
Name: 나라명, dtype: object
(7) 2018년, 2019년 모두 기록이 있는 나라들 중 년도별 행복수가 가장 증가한 나라와 그 증가 수치
# 방법(1)
year_2018 = hp[hp['년도'] == 2018]['나라명']
year_2019 = hp[hp['년도'] == 2019]['나라명']
year_2018_2019 = year_2019[year_2019.isin(year_2018)]
year_2018_2019
# 방법(2)
count = hp['나라명'].value_counts()
# print(count)
# count 값이 2이면 2018,2019에 모두 해당 되는 나라임
year_2018_2019 = count[count == 2].index
print(year_2018_2019)Index(['Finland', 'Albania', 'Nepal', 'Jordan', 'Benin', 'Congo (Brazzaville)',
'Gabon', 'Laos', 'South Africa', 'Venezuela',
...
'Kosovo', 'Romania', 'Cyprus', 'Argentina', 'Kuwait', 'Thailand',
'Latvia', 'South Korea', 'Estonia', 'Jamaica'],
dtype='object', name='나라명', length=152)
# 2018,2019에 모두 해당하는 나라들을 새로운 데이터프레임으로 생성
multiple = hp[hp['나라명'].isin(year_2018_2019)]
multiple.head()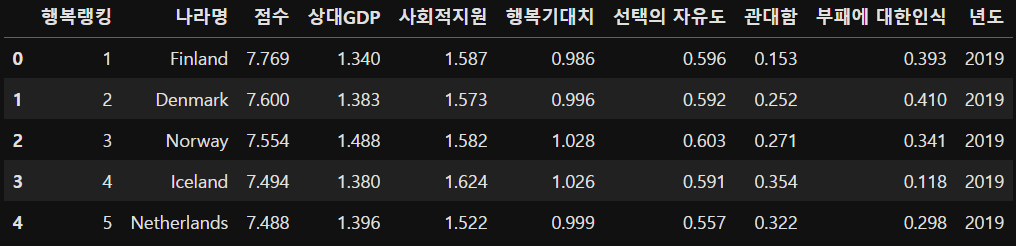
year_2019 = multiple[multiple['년도'] == 2019].sort_values('나라명')
year_2018_point = multiple[multiple['년도'] == 2018].sort_values('나라명')['점수']

# 새로운 컬럼 추가
year_2019['전년대비 행복점수 증감'] = year_2019['점수'].values - year_2018_point.values
year_2019

year_2019[year_2019['전년대비 행복점수 증감'].max() == year_2019['전년대비 행복점수 증감']][['나라명','전년대비 행복점수 증감']]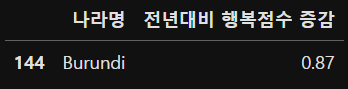
[문제 3] 유튜브 데이터 분석
yt = pd.read_csv('youtube_rank.csv')
(1) 컬럼 이름 변경
yt.columns = ['채널명','카테고리','구독자수','조회수','영상개수']
yt.head()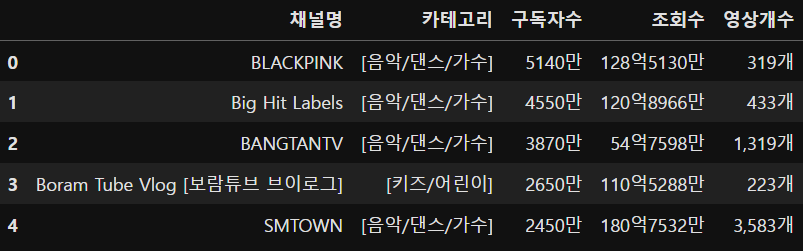
(2) 구독자수 컬럼과 조회수 컬럼의 타입을 정수형(int64)로 변경 (한글 삭제 후 변경)
yt['구독자수'] = yt['구독자수'].replace('만','0000', regex=True).astype(np.int64)yt['조회수'] = yt['조회수'].replace(['억','만'],['','0000'], regex=True).astype(np.int64)
(3) 영상개수 컬럼의 ','와 '개' 문자를 제거하고 정수형(int32)로 변경
yt['영상개수'] = yt['영상개수'].replace([',','개'], ['',''], regex=True).astype(np.int32)yt.info()<class 'pandas.core.frame.DataFrame'>
RangeIndex: 1000 entries, 0 to 999
Data columns (total 5 columns):
# Column Non-Null Count Dtype
--- ------ -------------- -----
0 채널명 1000 non-null object
1 카테고리 1000 non-null object
2 구독자수 1000 non-null int64
3 조회수 1000 non-null int64
4 영상개수 1000 non-null int32
dtypes: int32(1), int64(2), object(2)
memory usage: 35.3+ KB
(4) 인기 채널 확인 (구독자수와 조회수가 많은 5개의 채널 출력)
yt.sort_values('구독자수', ascending=False).head()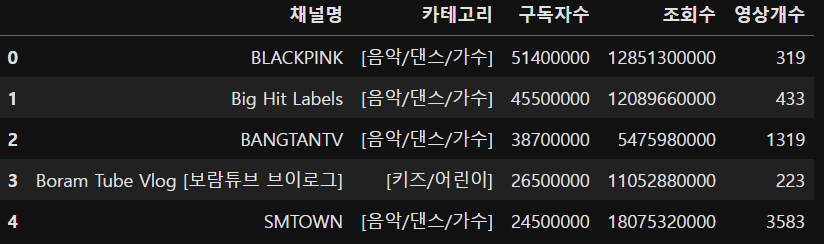
yt.sort_values('조회수', ascending=False).head()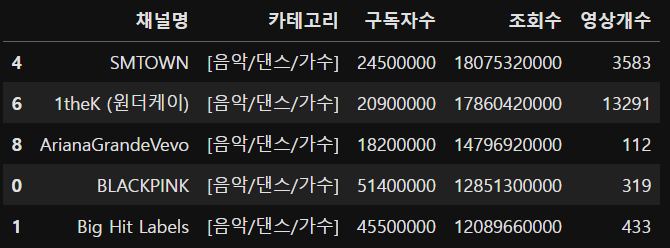
(5) 카테고리가 [음악/댄스/가수]인 채널의 구독자수 상위 5개 출력
# 방법(1)
yt.loc[yt['카테고리'] == '[음악/댄스/가수]', ['채널명','구독자수']].head()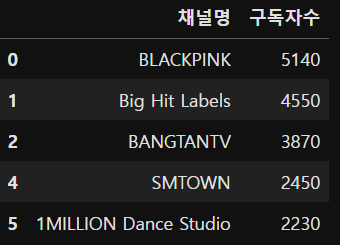
# 방법(2)
yt[yt['카테고리'] == '[음악/댄스/가수]'].sort_values('구독자수', ascending=False).head()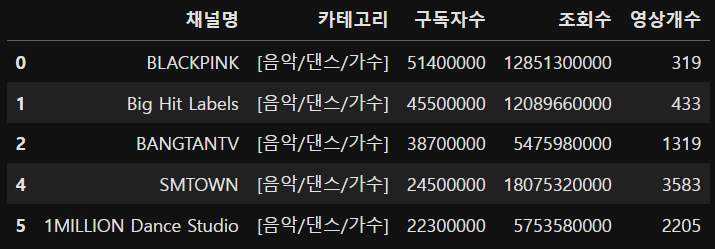
(6) 카테고리가 [TV/방송]이거나 [게임]인 채녈의 개수
# 방법(1)
yt.loc[np.logical_or(yt['카테고리'] == '[TV/방송]', yt['카테고리'] == '[게임]'),['채널명']].count()
채널명 262
dtype: int64
len(yt[yt['카테고리'].isin(['[TV/방송]', '[게임]'])]) # 262개
(7) 채널명에 KBS가 포함된 채널명 출력
yt[yt['채널명'].str.contains('KBS')][['채널명']]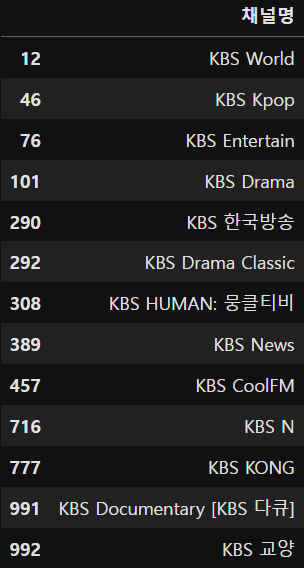
(8) 카테고리별 구독자수, 조회수, 영상개수의 평균
yt.groupby('카테고리')[['구독자수','조회수','영상개수']].mean().round(2)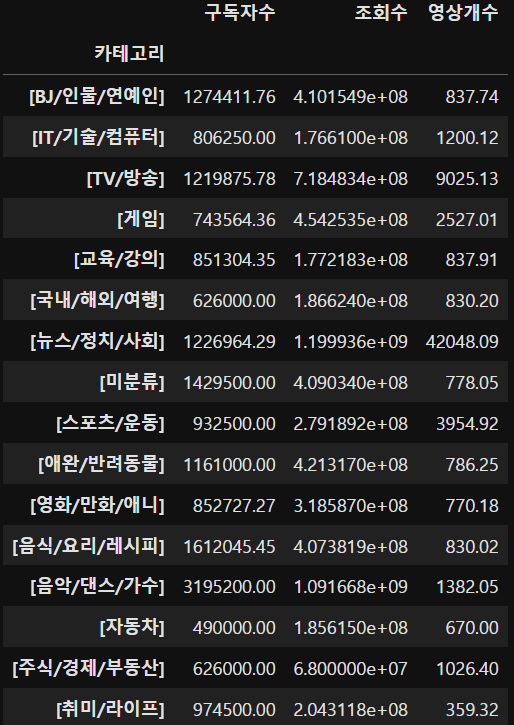
'데이터 분석 > 판다스' 카테고리의 다른 글
| [Pandas] 서울시 공공자전거 대여 정보 분석 2 (0) | 2023.11.14 |
|---|---|
| [Pandas] 서울시 공공자전거 대여소 정보 분석 1 (0) | 2023.11.14 |
| [Pandas] 품목별 수출입실적 분석 (0) | 2023.11.14 |
| [Pandas] 국가별 알콜 섭취량 데이터 분석 (0) | 2023.11.13 |
| [Pandas] 시애틀 강수량 데이터 분석 (0) | 2023.11.13 |