▶ map() 함수의 이용
import numpy as np

s = pd.Series(np.arange(10))
s
0 0
1 1
2 2
3 3
4 4
5 5
6 6
7 7
8 8
9 9
dtype: int32# 각각의 원소를 제곱한 값으로 바꾸기
s.map(lambda x:x**2)0 0
1 1
2 4
3 9
4 16
5 25
6 36
7 49
8 64
9 81
dtype: int64▶ map() 함수를 이용한 데이터 수정
- 데이터 전처리 중 하나인 labeling이나 one-hot encoding 처리 시 사용 ('명목형 데이터' -> 숫자 데이터로 변한)
s = pd.Series(['A','B','B','A','C','B'])
print(s)
0 A
1 B
2 B
3 A
4 C
5 B
dtype: object# 라벨링
map_data = {'A':0, 'B':1, 'C':2}
s.map(map_data)0 0
1 1
2 1
3 0
4 2
5 1
dtype: int64▶ map()을 DataFrame에 적용
df = pd.read_csv('wages.csv')
print(df.shape) # (1379, 6)
df.head()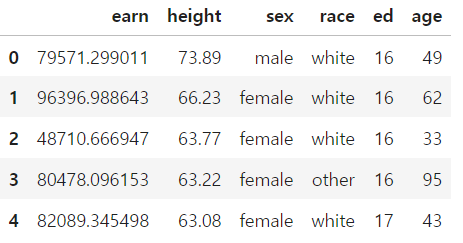
df['sex'].unique()
# 유니크한 레코드의 개수 세기
df['sex'].value_counts()
sex
female 859
male 520
Name: count, dtype: int64# 성별을 0과 1로 수정 (딕셔너리)
df['sex'] = df['sex'].map({'male':0, 'female':1})# 성별을 0과 1로 수정 (lambda)
df['sex'] = df['sex'].map(lambda x: 0 if x == 'male' else 1)df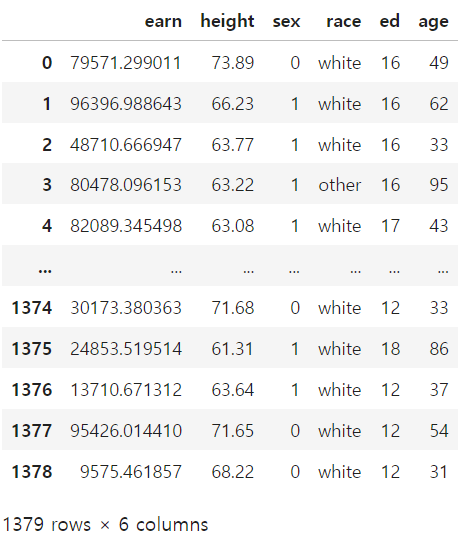
df['race'].unique()array(['white', 'other', 'hispanic', 'black'], dtype=object)# race컬럼의 값을 숫자로 수정
dic_race = {v:i for i, v in enumerate(df['race'].unique())}
df['race'] = df['race'].map(dic_race)
df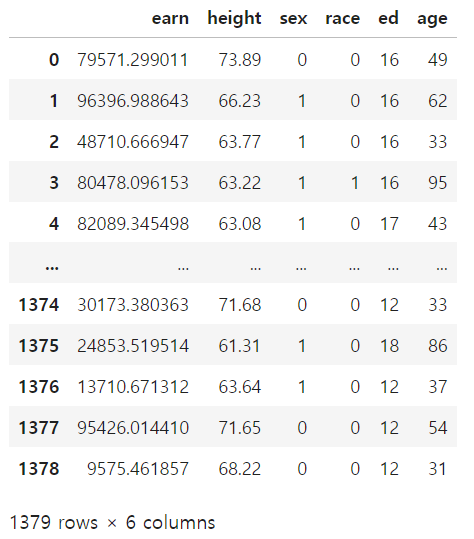
▶ replace() 함수를 이용한 데이터 수정
- sr.replace() : 정확하게 일치하는 단어를 찾아 바꾼다.
- 정규표현식에 의해 매칭되는 문자를 찾아 바꾸기 위해서는 regex=True 속성을 지정한다.
- sr.str.replace() : 일부 단어라도 일치하는 단어를 찾는다.
# 성별을 0과 1로 수정 (replace 함수)
df['sex'].replace(['male','female'], [0, 1], inplace=True)
df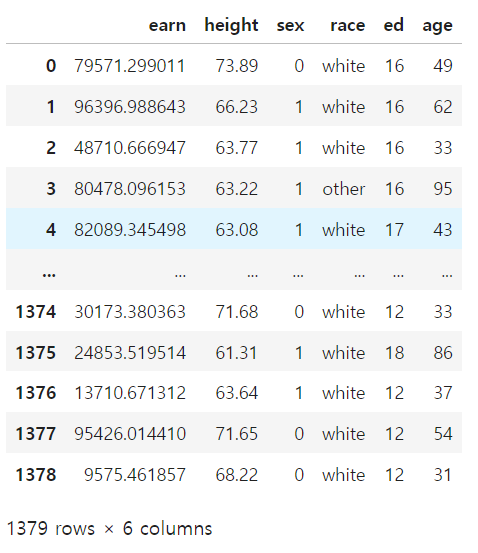
df = pd.DataFrame({'Code':np.arange(3),
                   'Name':['(S)Note Book', '(S)Note Book', '(S)PC']})
df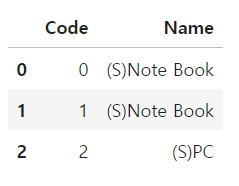
# (S) -> (M)으로 수정
# replace()는 정확히 일치하는 것만 바꾸기 때문에 변경되지 않음
df['Name'] = df['Name'].replace('(S)', '(M)')
df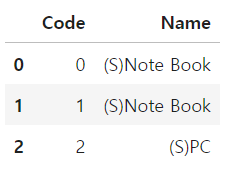
# 전체가 아닌 일부만 일치하는 것만 바꾸기 위해서는 정규표현식 사용
# 정규표현식에서 \는 그룹을 의미
df['Name'] = df['Name'].replace('\([A-Z]\)', '(M)', regex=True)
df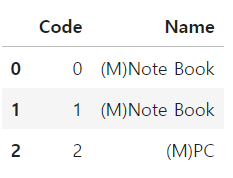
# 전체가 아닌 일부만 일치하는 것만 바꾸기 위해서는 시리즈 객체가 아닌 str 문자열을 대상으로 replace 사용
df['Name'] = df['Name'].str.replace('(S)','(M)')
df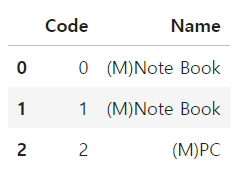
▶ apply() 함수의 사용
- DataFrame에 사용자 정의 함수 적용하기
df = pd.read_csv('wages.csv')
df_sample = df[['earn','height','age']]
df_sample.head()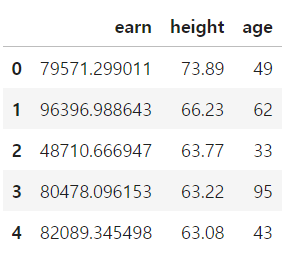
# 각 컬럼의 최대값과 최소값 차이 계산
df_sample.apply(lambda x: x.max() - x.min())
earn 318047.708444
height 19.870000
age 73.000000
dtype: float64# 각 컬럼의 최대값과 최소값을 시리즈 객체로 반환
def f(x):
return pd.Series([x.max(), x.min()], index=['max','min'])
df_sample.apply(f)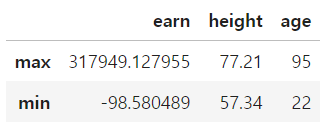
'데이터 분석 > 판다스' 카테고리의 다른 글
| [Pandas] 국가별 알콜 섭취량 데이터 분석 (0) | 2023.11.13 |
|---|---|
| [Pandas] 시애틀 강수량 데이터 분석 (0) | 2023.11.13 |
| [Pandas] DataFrame 합치기 (0) | 2023.11.13 |
| [Pandas] 시계열 데이터 (0) | 2023.11.10 |
| [Pandas] 개요 (0) | 2023.11.09 |